High Availability WordPress with GlusterFS

We decided to run a WordPress website in high availability mode on Amazon Web Services (AWS). I created 3 AWS instances with a Multi-AZ RDS running MySQL, move the existing database, the only missing thing is to share WordPress file on all machines (for uploads and WP upgrades). NFS was no option for me as I had bad experiences with stale connections in the past, so I decided to go with GlusterFS.

What is GlusterFS?

As per Wikipedia: GlusterFS is a scale-out network-attached storage file system. It has found applications including cloud computing, streaming media services, and content delivery networks. GlusterFS was developed originally by Gluster, Inc., then by Red Hat, Inc., after their purchase of Gluster in 2011.

Volumes shared with GlusterFS can work in multiple modes as Distributed, Mirrored (multi-way), Striped, or combinations of those.
Gluster Volumes

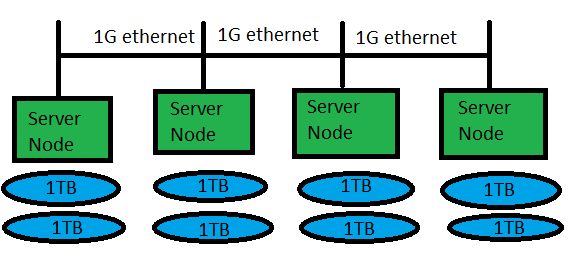
Gluster works in Server/Client mode, servers take care of shared volumes, clients mount the volumes and use them. In my scenario the servers and the clients are the same machines.

Preparation of Gluster nodes

1- Nodes will communicate on internal AWS network, so the following must go on each node’s /etc/hosts file:

XXX.XXX.XXX.XXX node-gfs1 # us-east-1b
XXX.XXX.XXX.XXX node-gfs2 # us-east-1d
XXX.XXX.XXX.XXX node-gfs3 # us-east-1d

2- Create AWS EBS volumes to be attached on each instance. Node that it’s good to create each volume in the availability zone of the instance.

3- Open firewall ports on local network:
Note: To mount them locally (client on the same server machine), must open proper below or else the FS might be mounted read only, according to the following guidelines:

– 24007 TCP for the Gluster Daemon
– 24008 TCP for Infiniband management (optional unless you are using IB)
– One TCP port for each brick in a volume. So, for example, if you have 4 bricks in a volume, port 24009 – 24012 would be used in GlusterFS 3.3 & below, 49152 – 49155 from GlusterFS 3.4 & later.
– 38465, 38466 and 38467 TCP for the inline Gluster NFS server.
– Additionally, port 111 TCP and UDP (since always) and port 2049 TCP-only (from GlusterFS 3.4 & later) are used for port mapper and should be open.

Installation steps

On each machine: install GlusterFS (server and client)

# yum install centos-release-gluster37
# yum install glusterfs-server

Then start the Gluster server process and enable it on boot:

# systemctl start glusterd
# systemctl enable glusterd
Created symlink from /etc/systemd/system/multi-user.target.wants/glusterd.service to /usr/lib/systemd/system/glusterd.service.
#

From first node: establish Gluster cluster nodes trust relationship:

# gluster peer probe node-gfs2
peer probe: success. 
# gluster peer probe node-gfs3
peer probe: success.

Now check the status of peer commands:

# gluster peer status
Number of Peers: 2
 
Hostname: node-gfs2
Uuid: 2a7ea8f6-0832-42ba-a98e-6fe7d67fcfe9
State: Peer in Cluster (Connected)
 
Hostname: node-gfs3
Uuid: 55b0ce72-0c34-441f-ab3c-88414885e32d
State: Peer in Cluster (Connected)
#

On each server: prepare the volumes:

# mkdir -p /glusterfs/bricks/brick1
# mkfs.xfs /dev/xvdf

Add to /etc/fstab:

UUID=8f808cef-c7c6-4c2a-bf15-0e32ef71e97c /glusterfs/bricks/brick1 xfs    defaults        0 0

Then mount it

Note: If you use the mount point directly I get the error:

# gluster volume create wp replica 3 node-gfs1:/glusterfs/bricks/brick1 node-gfs2:/glusterfs/bricks/brick1 node-gfs3:/glusterfs/bricks/brick1
volume create: wp: failed: The brick node-gfs1:/glusterfs/bricks/brick1 is a mount point. Please create a sub-directory under the mount point and use that as the brick directory. Or use 'force' at the end of the command if you want to override this behavior.

So create under each /glusterfs/bricks/brick1 mount point a directory used for GlusterFS volume, in my case I created /glusterfs/bricks/brick1/gv.

From server 1: Create a 3-way mirror volume:

# gluster volume create wp replica 3 node-gfs1:/glusterfs/bricks/brick1/gv node-gfs2:/glusterfs/bricks/brick1/gv node-gfs3:/glusterfs/bricks/brick1/gv
volume create: wp: success: please start the volume to access data
#

Check the status:

# gluster volume info
 
Volume Name: wp
Type: Replicate
Volume ID: 34dbacba-344e-4c89-875f-4c91812f01be
Status: Created
Number of Bricks: 1 x 3 = 3
Transport-type: tcp
Bricks:
Brick1: node-gfs1:/glusterfs/bricks/brick1/gv
Brick2: node-gfs2:/glusterfs/bricks/brick1/gv
Brick3: node-gfs3:/glusterfs/bricks/brick1/gv
Options Reconfigured:
performance.readdir-ahead: on
#

Now start the volume:

# gluster volume start wp
volume start: wp: success
#

Check the status of the volume:

# gluster volume status
Status of volume: wp
Gluster process                             TCP Port  RDMA Port  Online  Pid
------------------------------------------------------------------------------
Brick node-gfs1:/glusterfs/bricks/brick1/
gv                                          49152     0          Y       10229
Brick node-gfs2:/glusterfs/bricks/brick1/
gv                                          49152     0          Y       9323 
Brick node-gfs3:/glusterfs/bricks/brick1/
gv                                          49152     0          Y       9171 
NFS Server on localhost                     2049      0          Y       10249
Self-heal Daemon on localhost               N/A       N/A        Y       10257
NFS Server on node-gfs2                     2049      0          Y       9343 
Self-heal Daemon on node-gfs2               N/A       N/A        Y       9351 
NFS Server on node-gfs3                     2049      0          Y       9191 
Self-heal Daemon on node-gfs3               N/A       N/A        Y       9199 
 
Task Status of Volume wp
------------------------------------------------------------------------------
There are no active volume tasks
 
#

This is a healthy volume, if one of the servers goes offline it will disappear from the table above and reappears when it’s back online. Also peer status will be disconnected (from gluster peer status command).

Using the volume (Gluster clients)

Mount on each machine: In server 1 I will mount from server 2, from server 2 i will mount from server 3, from server 3 I will mount from server 1.

Using the syntax in /etc/fatab:

node-gfs2:/wp        /var/www/html      glusterfs     defaults,_netdev  0  0

Repeat it on each server as per my above note.

Now /var/www/html is shared on each machine in read/write mode.

References

  • http://severalnines.com/blog/scaling-wordpress-and-mysql-multiple-servers-performance
  • http://www.slashroot.in/gfs-gluster-file-system-complete-tutorial-guide-for-an-administrator
  • https://wiki.centos.org/HowTos/GlusterFSonCentOS

Protecting WordPress site with Fail2Ban

Recently, one of the web servers I’m responsible for got hammered with a distributed high load of HTTP requests that got the server down for 20 minutes. Once I got the server up again the distributed attack was still running and the case was clear from the log file, and we was able to stop it by temporarily banning the offending IPs (which by the way appears to be from Russia).

I had to find a quick solution since the attacker can start the distributed attack from new IPs other than the one we blocked. Few of the ways I thought about was to limit number of requests from the web server by denying further requests, or probably Intrusion Prevention System, or to use Fail2Ban. I decided to give Fail2Ban a try.

Why Fail2Ban?

Back when I used OpenBSD they introduced if I remember correctly a new SMTP server to only respond to spam’ing IPs, the idea was to load a list of IPs that are known to be spammers from SPAM list databases, when they arrive to mail server they are redirected to a so called stuttering SMTP. An SMTP service that consume spammer resource by slowing down the connection and keeping it open as long as possible.

I wanted to consume resource of our attackers as well, when Fail2Ban discover their behavior it will add offending IPs to be dropped by the firewall till their connection times out so we will stale them for some time. It’s not very effective, but at least that what i had in my mind.

What is Fail2Ban?

As per Wikipedia: Fail2ban is an intrusion prevention software framework that protects computer servers from brute-force attacks. Written in the Python programming language, it is able to run on POSIX systems that have an interface to a packet-control system or firewall installed locally, for example, iptables or TCP Wrapper.

It does so by monitoring log file for predefined regular expressions that contains IP of attackers with a set of criteria, like time window of the attack and number of tries, and when a match is found it takes action of preventing access of the offending IP, either add it to the firewall, hosts.deny and probably other actions.

Enough with blah blah and now with the technical stuff:

Software stack:

  • Varnish caching server (port 80)
  • Nginx (port 8080)
  • PHP-FPM (port 9000)
  • MySQL (port 3306)

Sample log entry in Nginx:

127.0.0.1 - - [15/May/2016:11:55:14 +0000] "POST /xmlrpc.php HTTP/1.0" 200 370 "-" "Mozilla/4.0 (compatible: MSIE 7.0; Windows NT 6.0)" "XXX.XXX.XXX.XXX"

Note that the offending URL appears as last entry not in the beginning as usually happens, because of Varnish.

On CentOS 7, I installed Fail2Ban using:

# yum -y install fail2ban

It will install Fail2Ban servers, client (which will connect to the server to control it or display information), and other utilities for testing and so (like fail2ban-regex).

No I defined the filter to match IP from the above log entry as:

# /etc/fail2ban/filter.d/nginx-wp-xmlrpc.conf:
# fail2ban filter configuration for nginx behind varnish running wordpress website.
# it will prevent brute force attacks for login via xmlrpc.
 
[Definition]
 
# Match the following:
# 127.0.0.1 - - [15/May/2016:22:40:37 +0000] "POST /xmlrpc.php HTTP/1.0" 200 370 "-" "Mozilla/4.0 (compatible: MSIE 7.0; Windows NT 6.0)" "XXX.XXX.XXX.XXX"
 
failregex = POST /xmlrpc.php HTTP/.*""$
ignoreregex =

Now to test it:

# fail2ban-regex /var/log/nginx/access.log /etc/fail2ban/filter.d/nginx-wp-xmlrpc.conf 
 
Running tests
=============
 
Use   failregex filter file : nginx-wp-xmlrpc, basedir: /etc/fail2ban
Use         log file : /var/log/nginx/access.log
Use         encoding : UTF-8
 
 
Results
=======
 
Failregex: 11774 total
|-  #) [# of hits] regular expression
|   1) [11774] POST /xmlrpc.php HTTP/.*"<HOST>"$
`-
 
Ignoreregex: 0 total
 
Date template hits:
|- [# of hits] date format
|  [16427] Day(?P<_sep>[-/])MON(?P=_sep)Year[ :]?24hour:Minute:Second(?:\.Microseconds)?(?: Zone offset)?
`-
 
Lines: 16427 lines, 0 ignored, 11774 matched, 4653 missed [processed in 2.17 sec]
Missed line(s): too many to print.  Use --print-all-missed to print all 4653 lines

11774 lines! 11774 attack attempts. And to be sure:

# grep "POST /xmlrpc.php" /var/log/nginx/access.log | wc -l
11774
#

No with the Jail for the offending IPs:

# /etc/fail2ban/jail.d/01-nginx-wp-xmlrpc.conf:
# For now if we got 20 occurrences of those in 2 minutes we will ban the offender
# ban for 12 hours</code>
 
[nginx-wp-xmlrpc]
 
enabled = true
logpath = /var/log/nginx/access.log
maxretry = 20
findtime = 120
bantime = 43200 # In secs. Or negative for permanent.
port = http,https

Now start the the server:

# systemctl start fail2ban
# systemctl enable fail2ban
Created symlink from /etc/systemd/system/multi-user.target.wants/fail2ban.service to /usr/lib/systemd/system/fail2ban.service.
#

Check the status of Fail2Ban server:

# fail2ban-client status
Status
|- Number of jail: 1
`- Jail list: nginx-wp-xmlrpc
# fail2ban-client status nginx-wp-xmlrpc
Status for the jail: nginx-wp-xmlrpc
|- Filter
| |- Currently failed: 0
| |- Total failed: 0
| `- File list: /var/log/nginx/access.log
`- Actions
|- Currently banned: 0
|- Total banned: 0
`- Banned IP list:
#

Make sure all is fine in: /var/log/fail2ban.log

Deploying Ceph – I: Initial environment

What is Ceph

Ceph is an Open Source Distributed Storage Platform, it stores data on a single cluster running on distributed computers. It and provides interfaces for object, block and file-level storage. Ceph is completely free and aims to be with no single point of failure, and to be scalable to the exabyte level.

Ceph is fault tolerant, it does so by replicating data across cluster. By default data stored in Ceph is replicated to 3 different storage devices. The replication level can be changed of course.

For simplicity, from a high level, when one of the storage devices fails, Ceph will replicate missing blocks to new device replacing the faulted one. An in depth technical explanation of this process will follow in the document.

Basic Ceph components

Cluster monitors (ceph-mon) that keep track of active and failed cluster nodes, it monitors the Ceph cluster, and report on its health and status.

Metadata servers (ceph-mds) that store the metadata of inodes and directories.

Object storage devices (ceph-osd) that actually store the content of files. This daemon is responsible for storing data on a local file system and providing access to this data over the network via different client software or access mediums. OSD daemon is responsible as well of data replication.

Data placement

Ceph stores, replicates and re-balances data objects across the cluster dynamically. To understand how Ceph places data in a cluster the following definition must be known:

Pools: Ceph stores data within pools, which are logical groups for storing objects. Pools manage the number of placement groups, the number of replicas, and the rule-set for the pool.

Placement Groups: This is the most important thing to understand. Ceph maps objects to placement groups (PGs). Placement groups (PGs) are shards or fragments of a logical object pool that place objects as a group into OSDs. Placement groups reduce the amount of per-object metadata when Ceph stores the data in OSDs. A larger number of placement groups (e.g., 100 per OSD) leads to better balancing.

In a nut-shell, if the replication level is 3 (default), each placement group will be assigned the exact number of OSDs (3), So when you have 4 way replication each PG will have 4 OSDs. When data is stored in the cluster, it will be assigned by the CRUSH algorithm (next section) to a PG to be stored. The PG will then replicate the data across all OSDs assigned to it, thus the data is stored 3 times (3 way replication).

Each OSD daemon is responsible for one storage device, so there is a one to one mapping between the number of OSDs and storage devices.

CRUSH Maps: CRUSH is a big part of what allows Ceph to scale without performance bottlenecks, without limitations to scalability, and without a single point of failure. CRUSH maps provide the physical topology of the cluster to the CRUSH algorithm to determine where the data for an object and its replicas should be stored, and how to do so across failure domains for added data safety among other things.

Explanation Scenario

This is not a real world example, it’s simple for explanation purposes only.

A Ceph cluster has 4 OSDs and a 3 way replication. Containing 10 PGs

PG1: OSD1, OSD2, OSD3
PG2: OSD2, OSD3, OSD4
PG3: OSD3, OSD4, OSD1
...

So when we store data to the Ceph cluster, the CRUSH algorithm will uniquely select the appropriate PG to place the data in the cluster, for example is selects PG2. PG2 will then replicate the data to the assigned OSDs (in this case OSD2, OSD3, OSD4 (3 way replication).

In the ideal case the PG will be in the state clean when all its OSDs are in state up and in, and when all the data is replicated correctly.

Failure scenario

In the above scenario, suppose had disk served by OSD1 has failed, PG1 and PG3 will be degraded and unclean state until the problem is fixed with the drive or get replaced. A new OSD can be introduced and the degraded PGs will assign in to replace OSD1 and start the process of re-balancing and replicating the data.

Deployment steps

The below setup is initial, it’s not the optimum of course for running a production storage based on Ceph. It’s a 3 way replication with two OSDs, so it’s degraded and unclean to begin with until we add more OSDs.

First disable firewall.

Command to be run as root will be indicated by using the # prompt, otherwise user ceph is used.

In this scenario:

– 1 manager node with: Ceph monitor. It’s used as well as the administration node. It has the following specs:

  • 2 vCPUs
  • 6 GB RAM
  • 60 GB Storage
  • VM running on XenServer 6.2
  • CentOS 7.2 OS

– 1 node used as storage node with the following specs:

  • 2 x quad code Intel Xeon processors with hyper-threading enabled (total of 16 vCPUs
  • 128 GB RAM
  • 2 x 2T SAS disk drives
  • CentOS 7.2 OS

Each disk drive above will be assigned to an OSD. Of course more OSDs and Monitor node will be added later.

We will install Ceph Hammer, although Jewel was release by the time of this deployment.

1- Add user ceph, to all nodes and give it passwordless sudo access:

# vi /etc/sudoers.d/ceph
Defaults:ceph !requiretty
ceph ALL = (root) NOPASSWD:ALL

Give it approperiate permissions:

# chmod 440 /etc/sudoers.d/ceph

2- Install needed packages to add yum repository for EPEL and Ceph on all nodes

# yum -y install centos-release-ceph-hammer epel-release yum-plugin-priorities

3- Make Ceph repository have priority over other repositories on all nodes.

Add “priority=1” after the “enabled=1” value in the /etc/yum.repos.d/CentOS-Ceph-Hammer.repo file.

4- Install the Ceph deployer package on the administration node

# yum -y install ceph-deploy

Now login as user ceph on the administration machine and continue with the following steps.

5- Generate and distribute SSH keys for the user ceph:

$ ssh-copy-id ceph@ceph-stor-01

Since the administration node is the first Ceph monitor, we need to set up the SSH key on the local machine as well:

$ cp id_rsa.pub .ssh/authorized_keys
$ chmod 600 .ssh/authorized_keys

6- Prepare local directoy for the installation

$ mkdir ceph
$ cd ceph/

7- Start deploying a new cluster, and write a .conf and keyring for it.

$ ceph-deploy new --cluster-network 192.168.140.0/24 --public-network 10.0.140.0/16 ceph-mon-01

Cluster network is the local private network for cluster communication, public network is were the Ceph nodes and Storage will be accessible on.

8- Start installing Ceph components on the monitor node:

Components to be installed, Ceph Monitor, Ceph MDS, Ceph RESt gateway

$ ceph-deploy install --mon --rgw --mds --release hammer ceph-mon-01

9- Deploy for monitors defined in `ceph.conf:mon_initial_members`, wait until they form quorum and then gatherkeys, reporting the monitor status along the process. If monitors don’t form quorum the command will eventually time out.

$ ceph-deploy mon create-initial

10- On the OSD node, install the OSD daemon on the Storage node containing the initial 2 OSDs:

$ ceph-deploy install --release hammer --osd ceph-stor-01

11- Copy the key rings and configuration files on all nodes:

$ ceph-deploy admin ceph-mon-01 ceph-stor-01
$ sudo chmod 644 /etc/ceph/ceph.client.admin.keyring

12- Prepare Object Storage Daemon on the initial OSD node:

First ceph-stor-01 node has 2 disk drives, we dedicate 1.6T on each drive for a separate OSD. File system used is XFS.

$ ceph-deploy osd prepare ceph-stor-01:/ceph/storage01 ceph-stor-01:/ceph/storage02

13- Activate Object Storage Daemon

$ ceph-deploy osd activate ceph-stor-01:/ceph/storage01 ceph-stor-01:/ceph/storage02

14- Some commands o make sure we are on the right track

Check available storage:

$ ceph df
GLOBAL:
SIZE AVAIL RAW USED %RAW USED
3214G 3204G 10305M 0.31
POOLS:
NAME ID USED %USED MAX AVAIL OBJECTS
rbd 0 0 0 1068G 0

Check cluster status:

$ ceph -w
cluster 1ad7d5ae-3414-4286-b42e-7082b3355fde
health HEALTH_WARN
64 pgs degraded
64 pgs stuck degraded
64 pgs stuck inactive
64 pgs stuck unclean
64 pgs stuck undersized
64 pgs undersized
monmap e1: 1 mons at {ceph-mon-01=10.0.140.154:6789/0}
election epoch 2, quorum 0 ceph-mon-01
osdmap e9: 2 osds: 2 up, 2 in
pgmap v15: 64 pgs, 1 pools, 0 bytes data, 0 objects
10305 MB used, 3204 GB / 3214 GB avail
64 undersized+degraded+peered</code>
 
2016-04-28 23:41:34.137681 mon.0 [INF] pgmap v15: 64 pgs: 64 undersized+degraded+peered; 0 bytes data, 10305 MB used, 3204 GB / 3214 GB avail

It’s degraded, will remain so until we add more OSDs (again, because it’s a 3 way replication with only 2 OSDs)